Es ist so weit: Unser App-Builder geht offiziell an den Start! Mit dieser Version unserer No-Code-Datenbank mit integriertem No-Code-App-Builder kann jeder, ob Programmierer oder Citizen Developer, künftig ganz einfach eigene Apps erstellen! Mit SeaTable 5.0 sind wir bereit, auf dem internationalen Markt eine führende Position in der digitalen Transformation und Innovation einzunehmen.
Doch das ist nicht der einzige Paukenschlag – in SeaTable 5.0 stehen Ihnen drei neue Plugins für komplexe Visualisierungen zur Verfügung: Organigramm, Tabellenbeziehungen und Whiteboard. Die verbesserte Barrierefreiheit soll Menschen mit (Seh-)Beeinträchtigung die Nutzung von SeaTable erleichtern. Ein weiteres Glanzlicht setzt der spaltengenaue Excel-Import.
Heute Morgen haben wir SeaTable Cloud auf Version 5.0 aktualisiert. Alle Selbsthoster können das ebenfalls tun: Das Image von SeaTable 5.0 ist im bekannten Docker Repository zum Download verfügbar. Im Changelog finden Sie wie immer die vollständige Liste der Änderungen.
Ohne Code zur individuellen Business-App
Mit SeaTable 5.0 geht unser No-Code-App-Builder offiziell an den Start. Nachdem unsere Entwickler über die letzten Versionen hinweg viele neue Funktionen und Verbesserungen in den App-Builder implementiert haben, steht der Umsetzung Ihrer anspruchsvollen Anwendungsfälle nun nichts mehr im Weg. Erstellen Sie individuelle Business-Apps, ohne eine einzige Zeile Code zu schreiben, und nutzen Sie SeaTable als Frontend und Backend in einem!
Neuer Seitentyp: Einzelner Datensatz
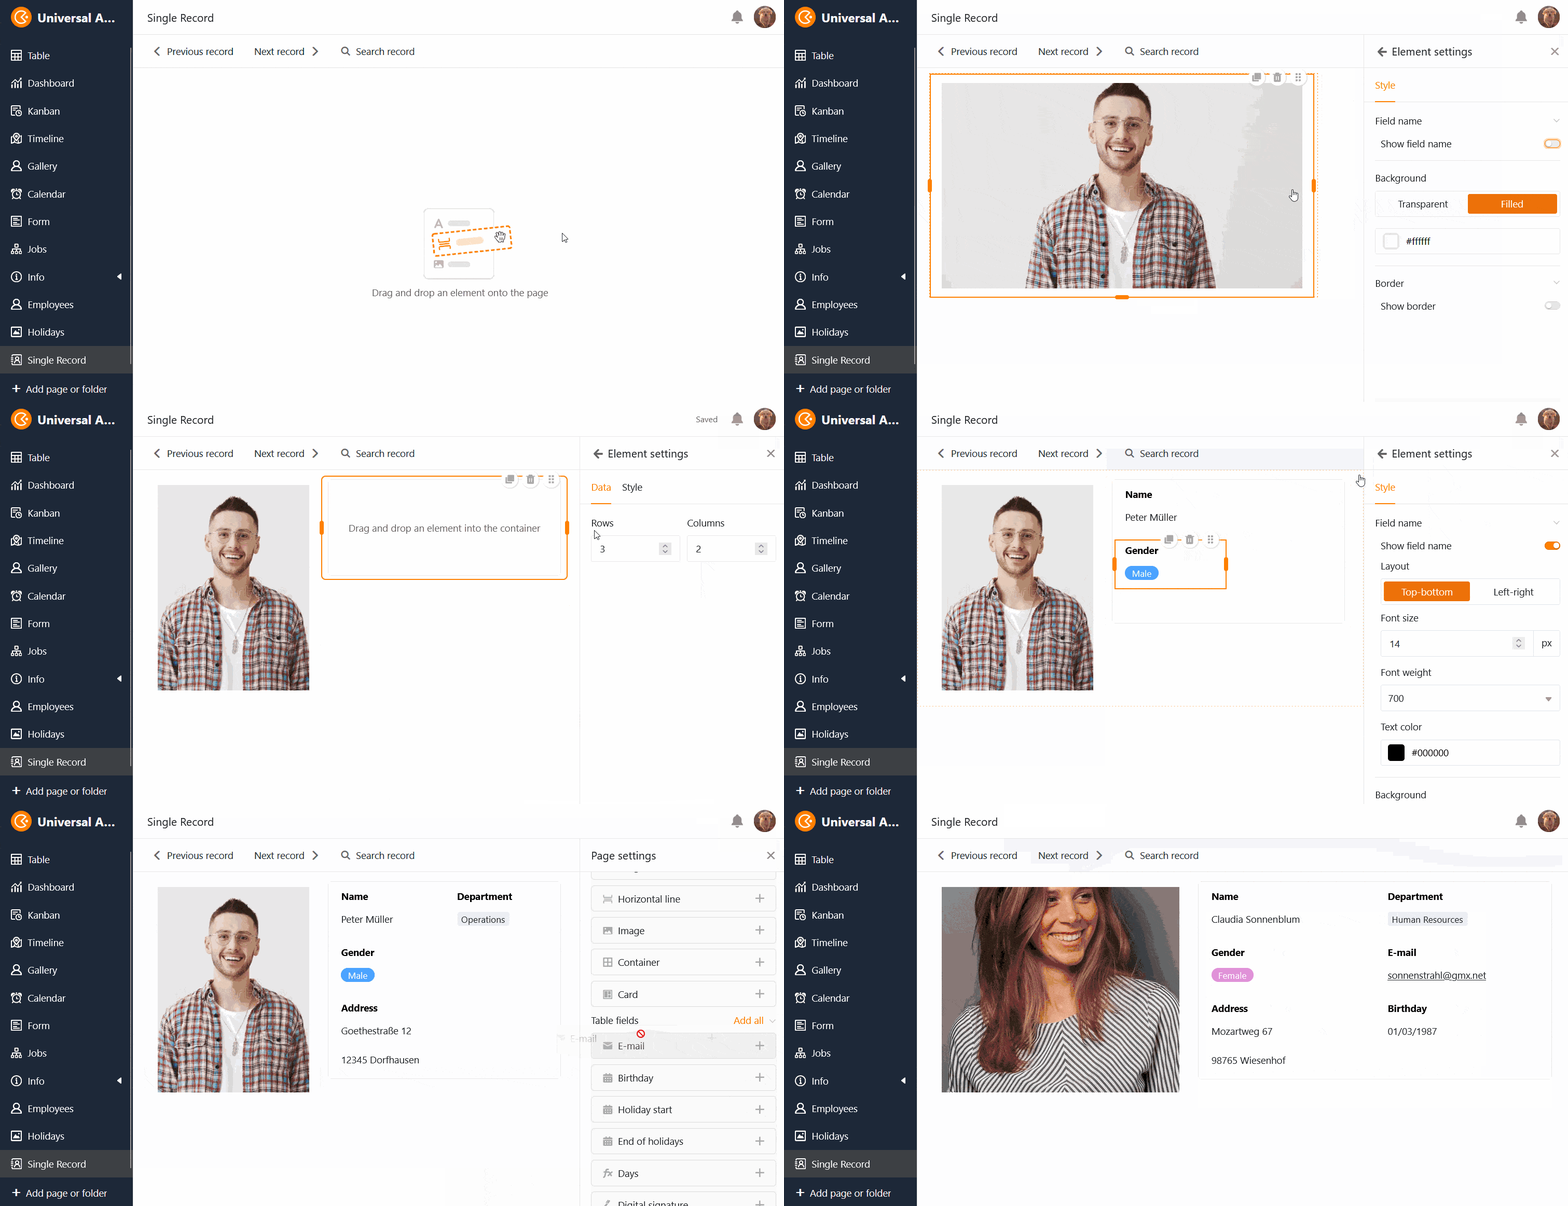
Die Entwicklung des App-Builders geht unvermindert weiter: Mit dem Seitentyp Einzelner Datensatz haben Sie die Möglichkeit, eine Seite mit statischen Elementen, Tabellenfeldern, Farben, Rahmen etc. zu designen, um die in einer Zeile gespeicherten Daten optisch aufzubereiten. Damit ähnelt dieser Seitentyp dem Seitendesign-Plugin, das Sie bereits aus der Base kennen.
Die Nutzer der App können auf dieser Seite – mit der jeweiligen Berechtigung – die einzelnen Datensätze sehen, suchen, durchblättern und bearbeiten. Dieser Seitentyp eignet sich zum Beispiel, um die Daten in einer Mitarbeiterdatenbank als persönliche Steckbriefe anzuzeigen.
Neue Funktionen bestehender Seitentypen
Auf Tabellenseiten können Sie ab sofort alle angezeigten Daten als Excel-Datei exportieren. Zudem können Sie über den Spaltenkopf von Bild- und Datei-Spalten alle Anhänge als Zip-Datei herunterladen. Die neuen Export-Funktionen sind hilfreich, wenn Sie anderen Nutzern bestimmte Dateien über die App zur Verfügung stellen möchten.
Auf Galerieseiten haben wir die Einstellungen von Verknüpfungsspalten ergänzt. So können Sie zum Beispiel festlegen, ob die Nutzer über die Galerieseite bestehende Einträge verknüpfen oder Einträge in einer anderen Tabelle hinzufügen dürfen. Auf Abfrageseiten aktualisieren sich die Abfrage-Ergebnisse nun sofort, wenn Sie Schaltflächen-Aktionen auslösen, die Veränderungen an den Daten bewirken.
Drei Plugins für komplexe Visualisierungen
Ein weiteres Highlight von SeaTable 5.0 sind die neuen Plugins, mit denen man die Abhängigkeiten, Strukturen und Prozesse in einer Base visualisieren kann.
Organigramm
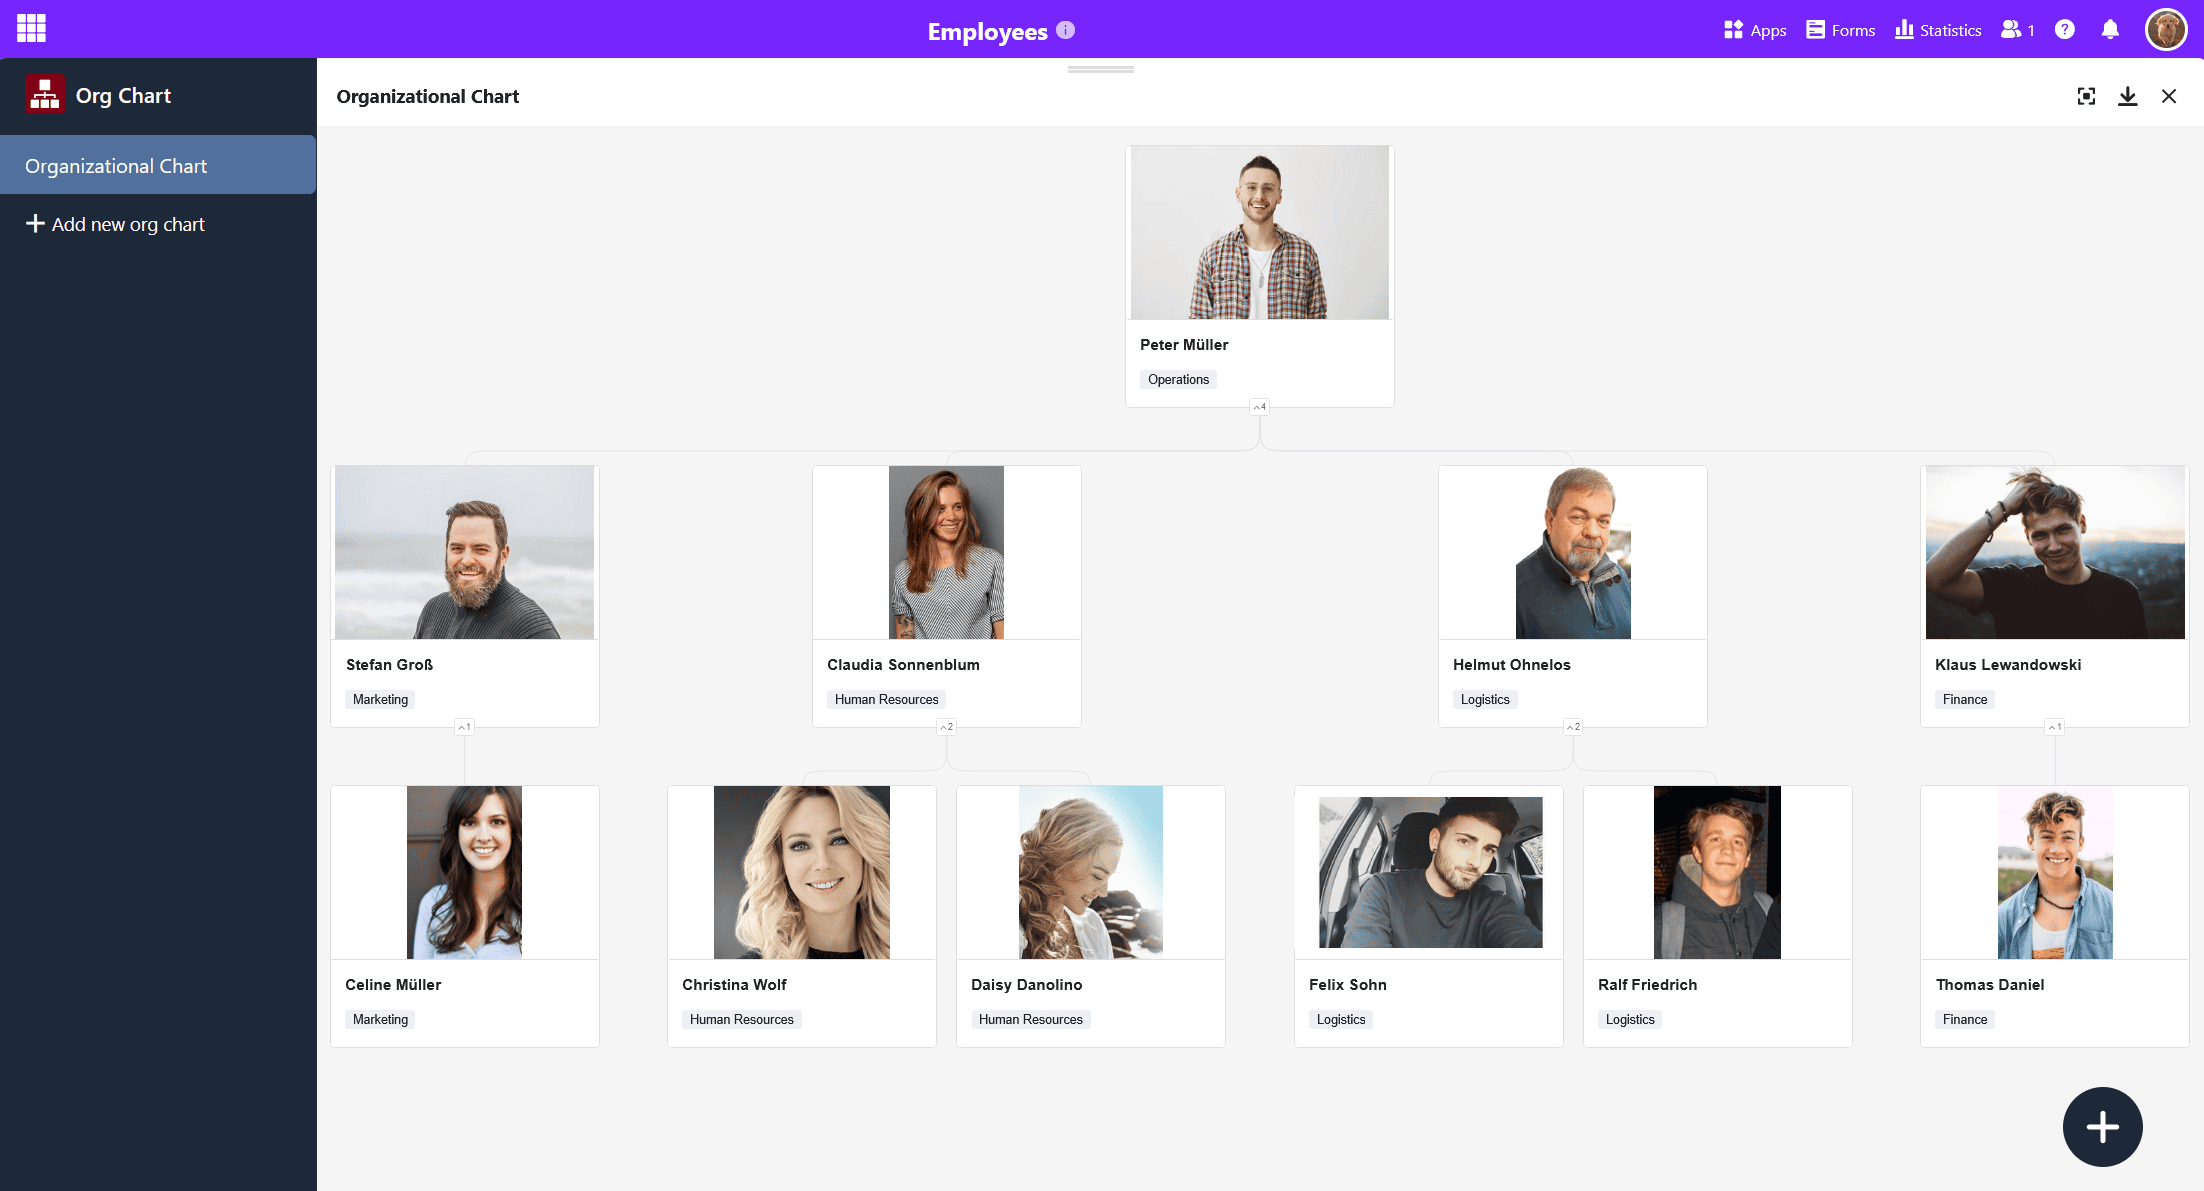
Mithilfe des Organigramm-Plugins lassen sich Hierarchien zwischen den Datensätzen in einer Tabelle darstellen, z. B. Positionen in einem Unternehmen oder über- und untergeordnete Aufgaben in einem Projekt. Um die Abhängigkeiten der Datensätze zu visualisieren, brauchen Sie eine Link-Spalte, die auf ein und dieselbe Tabelle referiert. Der Eintrag, mit dem Sie eine andere Zeile derselben Tabelle verlinken, wird als übergeordneter Datensatz dargestellt.
Tabellenbeziehungen
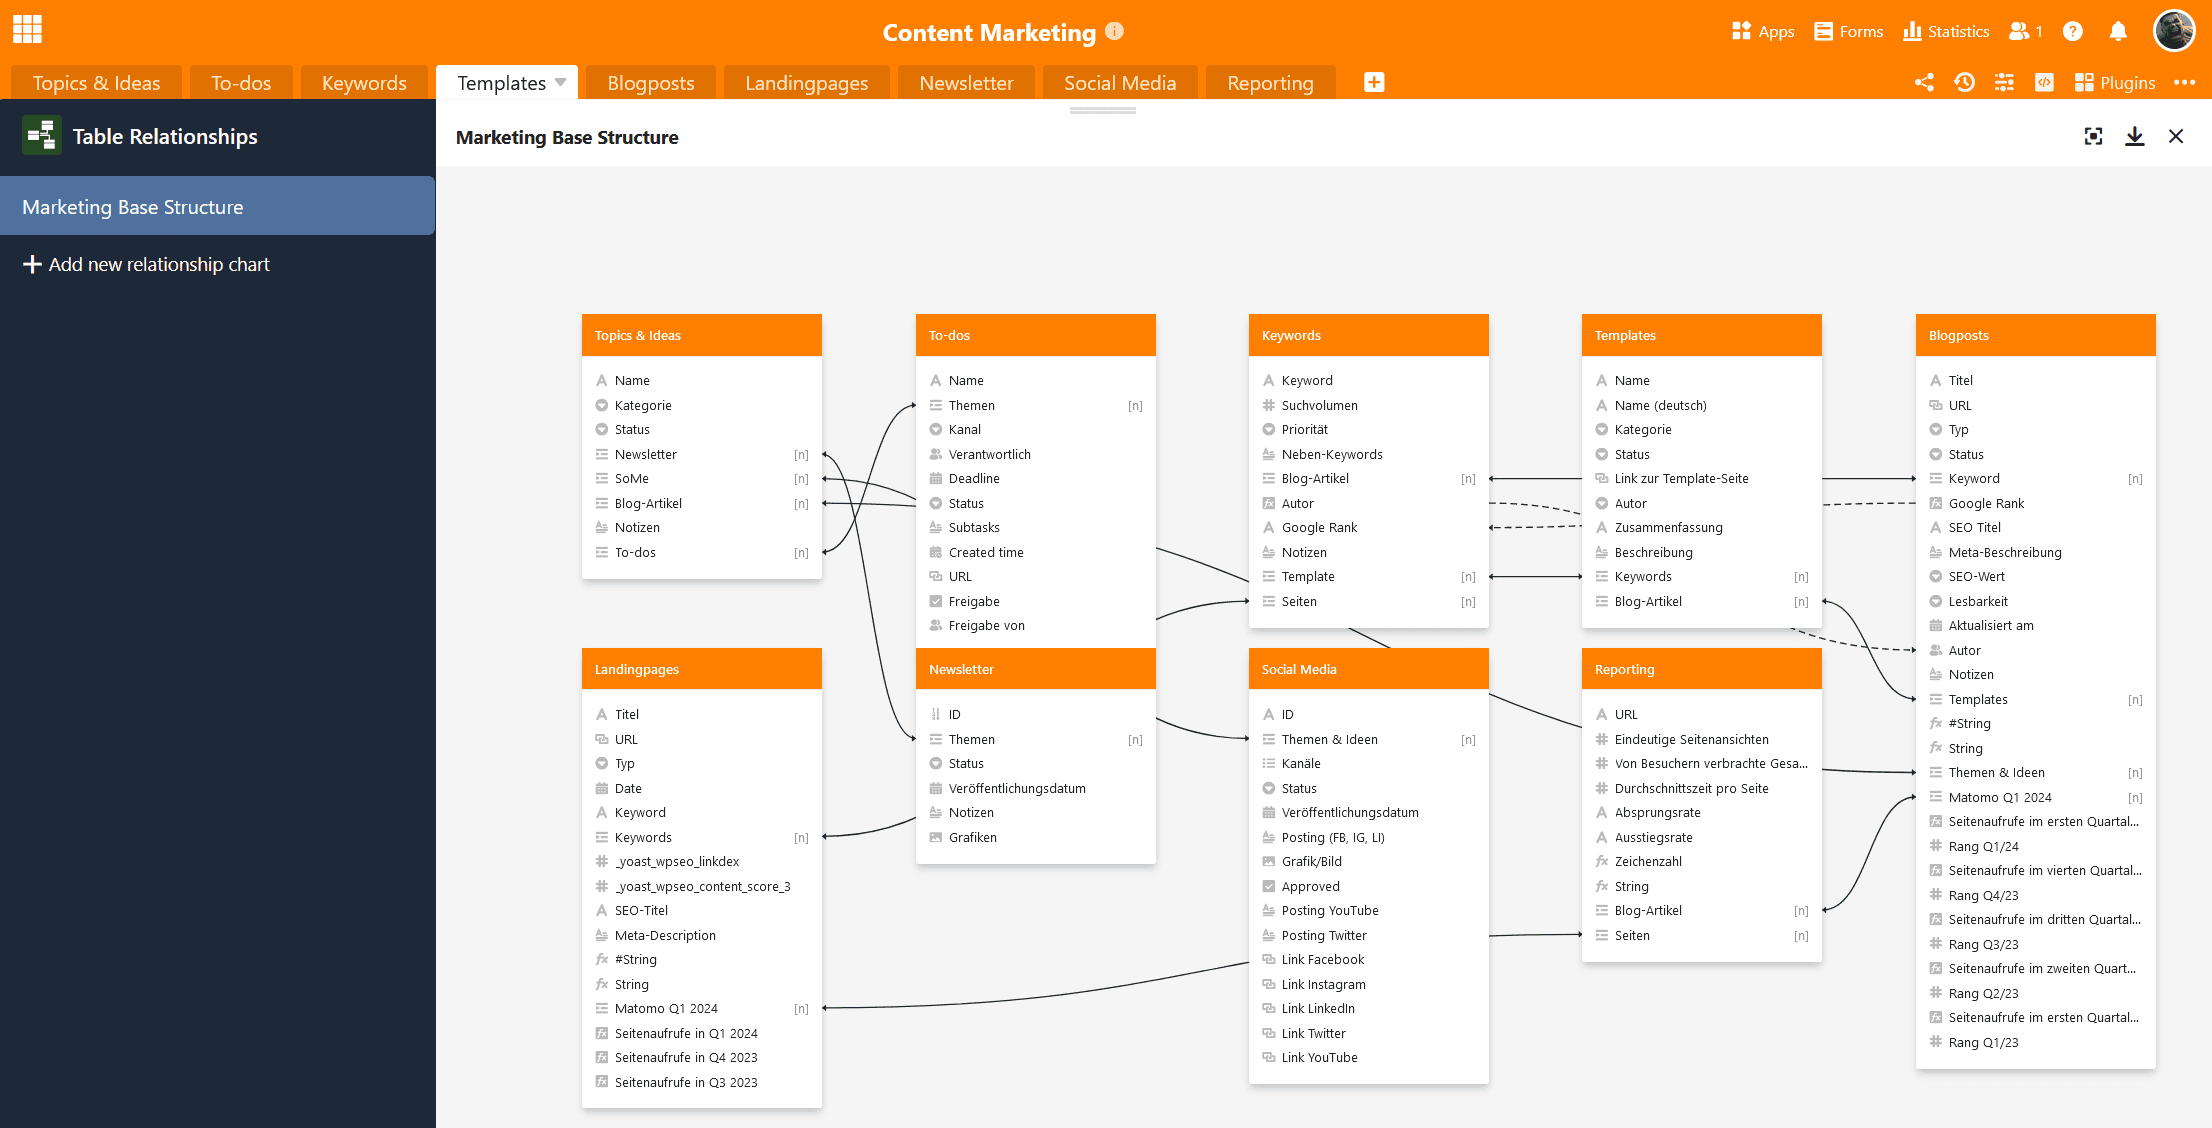
Besonders wenn sich viele Tabellen mit Tausenden Zeilen in einer Base befinden, verliert man schnell den Überblick, wie diese miteinander in Beziehung stehen. Mithilfe des neuen Tabellenbeziehungen-Plugins können Sie sichtbar machen, welche Tabellen über welche Spalten miteinander verknüpft sind. Dabei werden nicht nur direkte Verbindungen über Link-Spalten, sondern auch indirekte Verbindungen über Linkformel-Spalten angezeigt.
Whiteboard
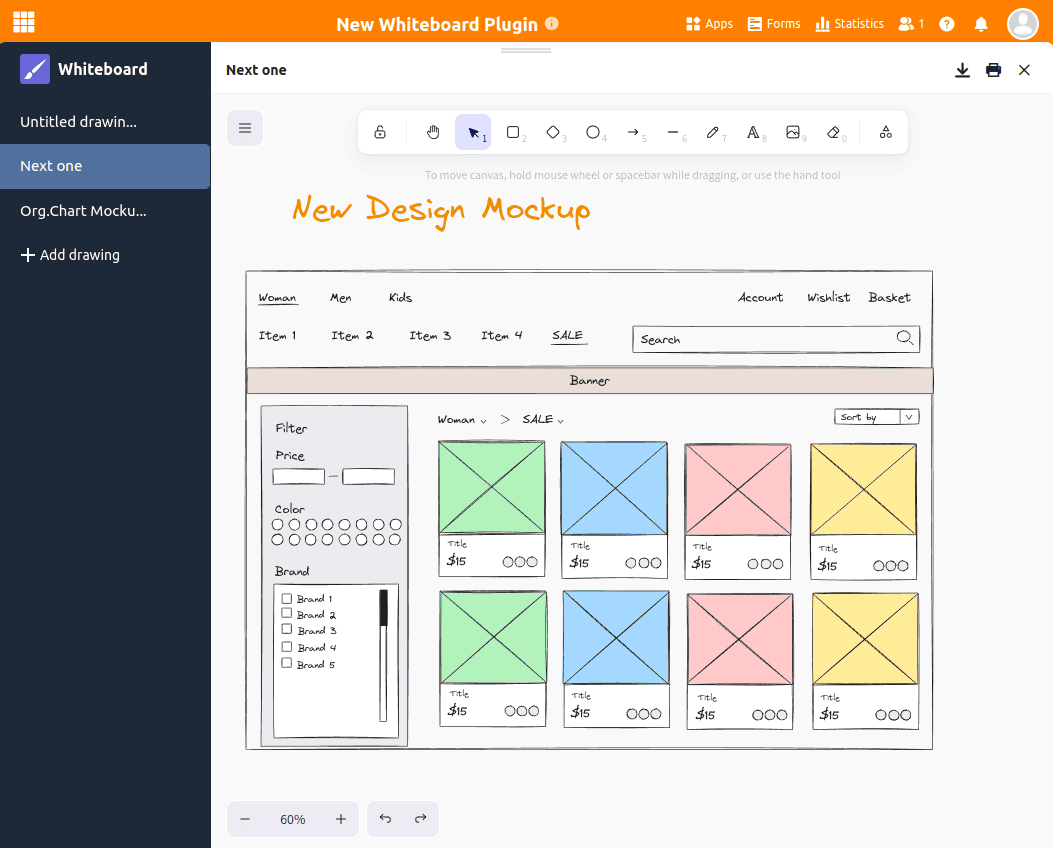
Das Whiteboard ist das erste Plugin, das losgelöst von den Daten in einer Base funktioniert. Es gibt Ihnen die Freiheit, Prozesse und Strukturen grafisch zu visualisieren, die Sie mit den bisherigen Plugins nicht darstellen können. Ebenso können Sie Layouts und Mockups frei skizzieren. Für die Gestaltung haben Sie verschiedene Elemente wie Vierecke, Ellipsen und Pfeile sowie Werkzeuge wie Stift und Radierer zur Auswahl.
Verbesserte Barrierefreiheit
SeaTable möchte allen Benutzern einen optimalen Zugang zu seiner digitalen No-Code-Lösung ermöglichen. Daher haben wir für SeaTable 5.0 viel in die Verbesserung der Barrierefreiheit investiert. Dazu gehören die Optimierung der ARIA-Tags für eine verbesserte Unterstützung von nicht-visuellen Ausgabegeräten, Anpassungen an der Farbgebung für stärkere Kontraste und die Überarbeitung der Tastatursteuerung.
Mit Version 5.0 erreichen wir das Ziel, für die wichtigsten Seiten von SeaTable einen Lighthouse Accessibility Score von 90 und größer zu erzielen. Ab diesem Wert können Webseiten als im Wesentlichen barrierefrei gelten. Natürlich werden wir unsere Bemühungen um Barrierefreiheit in Zukunft mit unseren Partnern fortsetzen.
Spaltengenauer Excel-Import
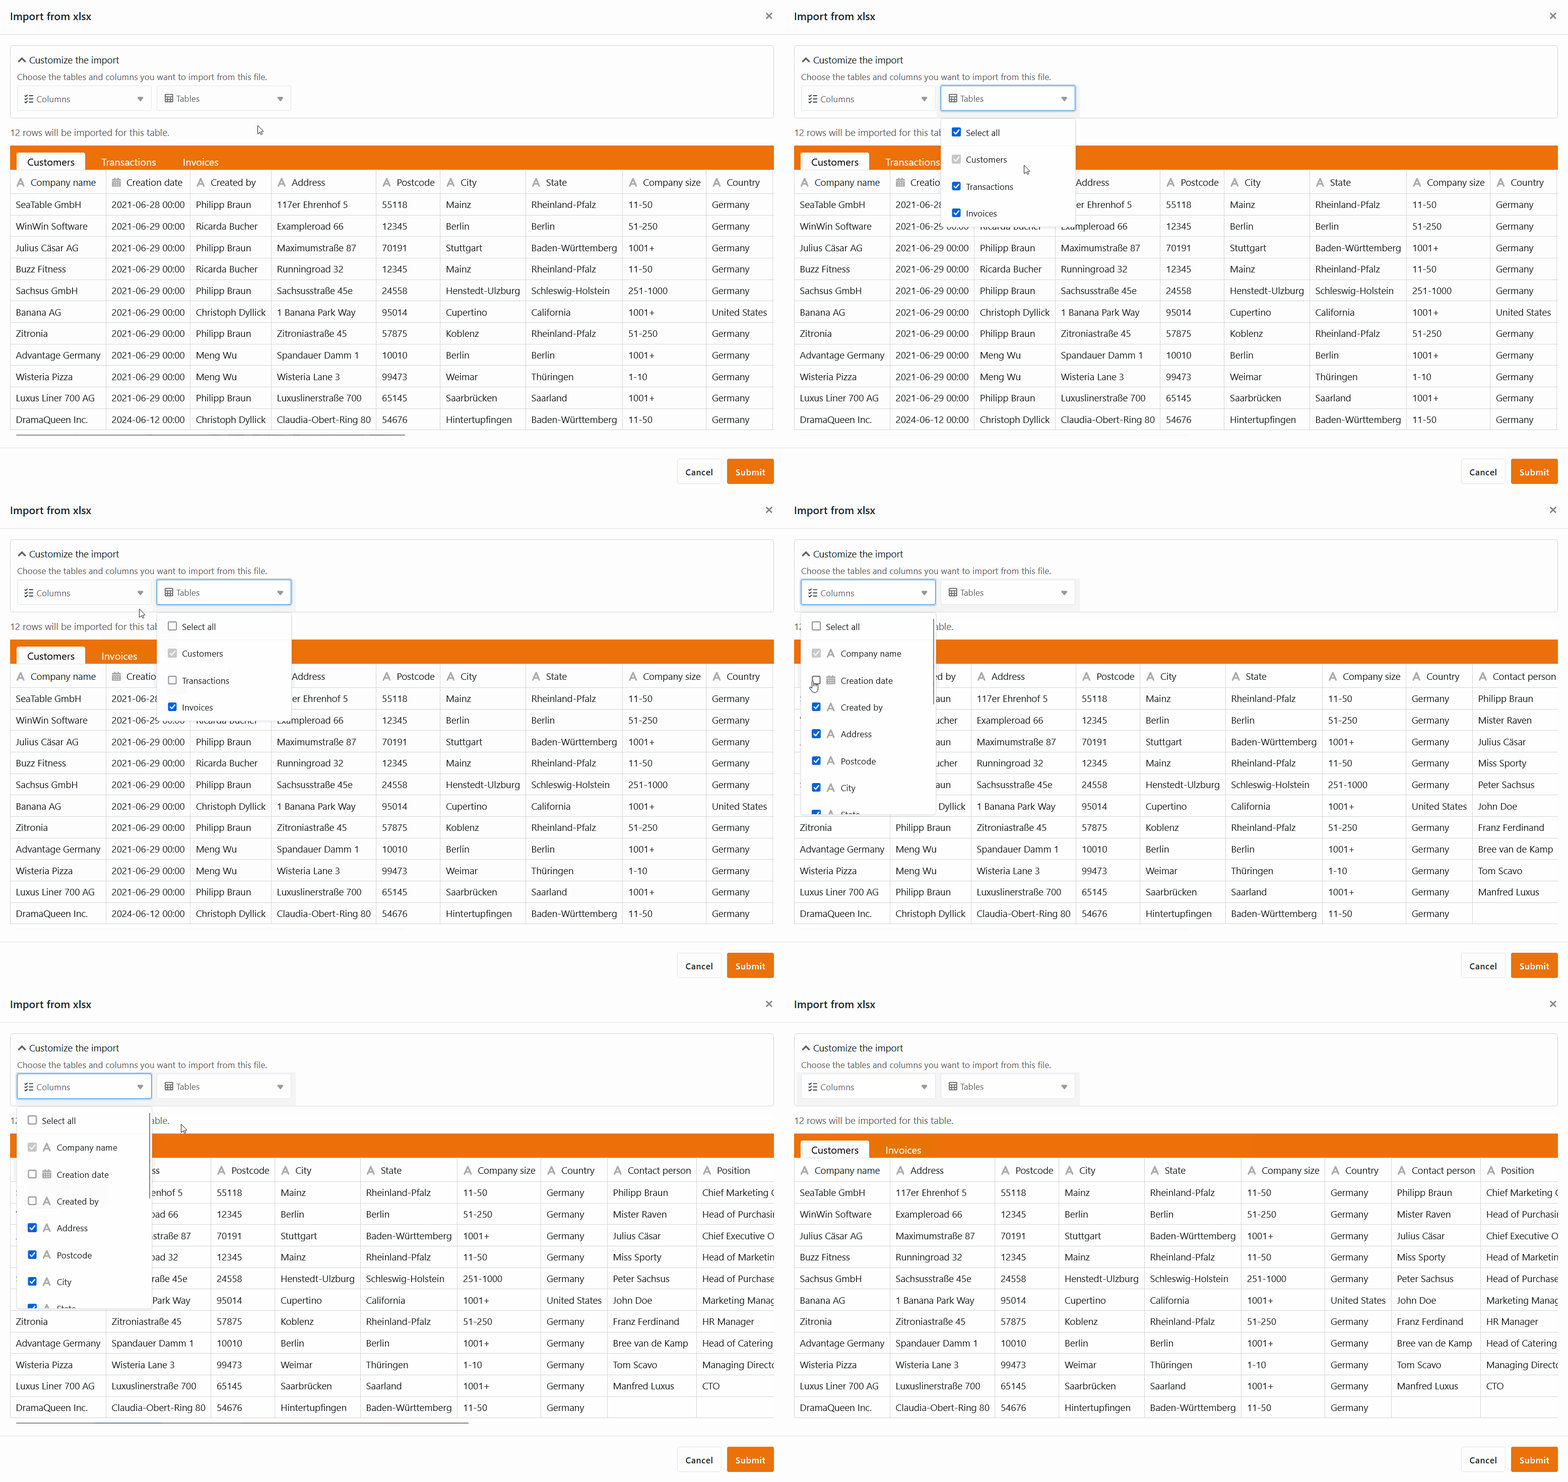
Bereits in Version 4.4 wurde der Import von XLSX-Dateien schneller, flexibler und stabiler. Mit SeaTable 5.0 wird der Import-Wizard noch leistungsfähiger: Im deutlich aufgewerteten Vorschaufenster können Sie jetzt detailliert selektieren, welche Tabellen – und sogar welche Spalten einer XLSX-Arbeitsmappe – SeaTable importieren soll. Wählen Sie unerwünschte Tabellen und Spalten einfach ab, um den Datenimport genauestens zu steuern.
Optimierung der API von SeaTable Cloud
Im Rahmen von SeaTable 5.0 haben wir auch einige Änderungen an der SeaTable API vorgenommen. Dies betrifft nur Anwender, die mithilfe der API ihre eigenen Anwendungen und Workflows umsetzen. Auf die Arbeit im Browser haben diese Änderungen keinen Einfluss.
Hier die wichtigsten Punkte in der Übersicht:
- Die API-Endpunkte Get Row und List Rows werden auf das neue API-Gateway umgeleitet.
- Das Format der Rückgabewerte von Link- und Linkformel-Spalten wird harmonisiert.
- Das API-Gateway liefert zukünftig das aktuelle API-Nutzungslimit zurück.
Wenn Sie mehr erfahren wollen, finden Sie in diesem Forumspost alle Details zu den Änderungen.
Und vieles mehr
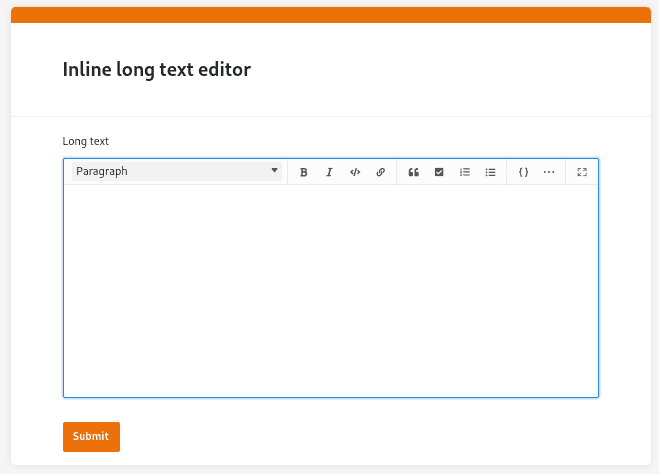
Dem Editor für lange Texte begegnen Sie an vielen Stellen. Wenn Sie formatierte Textfelder in den Zeilendetails oder in Webformularen ausfüllen, werden Sie bemerken, dass sich nun die Usability verbessert hat: Der Editor für lange Texte öffnet sich nicht mehr in einem weiteren Pop-up-Fenster, sondern inline, sodass Sie direkt losschreiben können.
Auch die Statistiken kennen Sie von mehreren Stellen in SeaTable: vom Statistik-Modul in der Base sowie von individuellen Seiten in Universellen Apps. Mit einer überarbeiteten Diagramm-Bibliothek haben wir die Statistiken nun deutlich aufgewertet und vereinheitlicht.
Früher konnten Sie Zeilen, die Sie in den Big-Data-Speicher verschoben hatten, nicht über Snapshots wiederherstellen. Um unerwünschtem Datenverlust vorzubeugen, gibt es nun die Option, bei der Wiederherstellung von Snapshots auch den Big-Data-Speicher der damaligen Version wiederherzustellen.
