Thanks to the filter, sorting and grouping evaluation tools, simple analyses can be carried out with just a few clicks. SeaTable also knows various operations for data processing, which you can use to calculate cumulative values or create ranked lists, for example. For detailed evaluations with pivot tables, diagrams and graphical representations, SeaTable offers the statistics module.
In this article you will learn how to create statistical analyses and appealing graphics with SeaTable.
Filter, sort and group
With filters, groupings and sortings, you can bring order to your data in no time at all and prepare it for your various use cases. By combining these simple analysis tools, which you can find centrally in every table view, even large amounts of data become structured and manageable. You can save different views to access them later.
At the statusrow you can read the number of rows in a view and certain column values. You can choose between the sum, the average, the median, the maximum or the minimum of all values in a column. You can also determine these column values for individual groupings.
Data processing operations
You can perform various operations using the data processing function. You can perform mathematical calculations across all values in a column as well as correlate values when entries in two different tables are identical. Useful statistical evaluations are, for example, cumulative values, percentages or ranked lists.
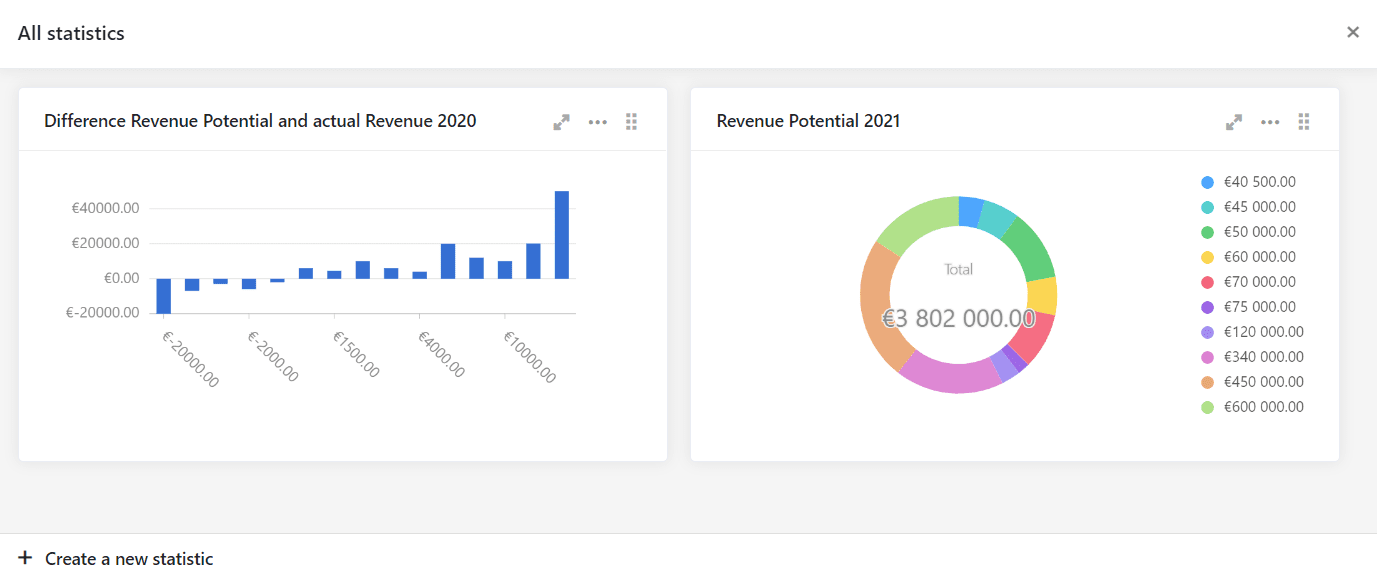
Statistics
For more extensive data evaluations, SeaTable offers you various statistics. As with the views, you can of course save your statistical evaluations in order to access them at any time in the future.
With the statistics module, you can visualize data in diagrams or evaluate it in detail using pivot tables. You can create and save any number of such evaluations in each base.
Charts and pivot tables are managed on the dashboard of the statistics module. All charts and pivot tables created are saved there and are available for retrieval at any time. All existing statistics are automatically updated when you change data in the table. So you never have to think about updating the statistics - SeaTable does it for you!
The evaluations displayed in the statistics module always refer to a table in the open base. You define the data basis for the visualization and evaluation by selecting the view to be used. If you only want to create a chart or a pivot table for part of the data in a table, create a suitable view. You will not find any filter functions in the statistics module itself. For this reason, you must always define the relevant data in a view before creating a statistic.
The statistics module supports a variety of chart types, for example:
- Bar and column charts (for displaying frequency distributions)
- Line charts (for the representation of a value over time)
- Pie charts (for simple visualisation of proportions)
Use the instructions for the statistics module to create a new diagram step by step. Due to the simplicity of some chart types, the setting options there are limited compared to the other types.
