Depending on the task and the collected data, different display modes are useful to facilitate your work in SeaTable. SeaTable offers you views for this purpose on the one hand: Quantitative data is best captured in the table view, structured with filters, sorting and grouping, and analyzed with the help of statistics.
For the advanced types of data that you can store and organize in SeaTable, there are advanced views in the form of plugins. For example, for scheduling, the Timeline and Calendar prove to be particularly helpful. For images, the gallery is useful, and for geographic data, the map. A Kanban board makes sense especially for groupings of single selections.
In this post, learn which views and plugins are available, how you can use them, and for which use cases they are particularly suitable.
Table view
SeaTable has a table view for the most common use cases. Here your data is recorded in a table consisting of rows and columns. The Table View is SeaTable's default view: when you open a Base, you first see your data in table form.
The Table View is essential for manually entering, editing and managing data in a Base: In it, you create the tables and define the column structure. Each column is assigned a type that captures specific data.
The table view is particularly suitable for displaying text- and number-based data. Using the available view settings such as grouping, sorting and filters, you can also perform simple evaluations very quickly.
In the Status-row you can keep an eye on the number of rows and the column values at all times.
Statistics
To create diagrams and visualize numbers, use SeaTable's statistics module. It allows for more complicated evaluations than is possible in the table view. In addition, it offers a wide range of graphical display options with a variety of supported chart types.
Extensive information about the statistical evaluation options can be found in the instructions for the statistics module.
Advanced views
With the help of plugins, the table view can be supplemented with additional display options. These extend SeaTable's possible fields of application beyond the purely quantitative analysis of numerical data - enabling SeaTable to be used for use cases that a classic spreadsheet cannot cover.
Plugins allow you to view your data from different angles. In doing so, the data set always remains exactly the same, only the representation changes.
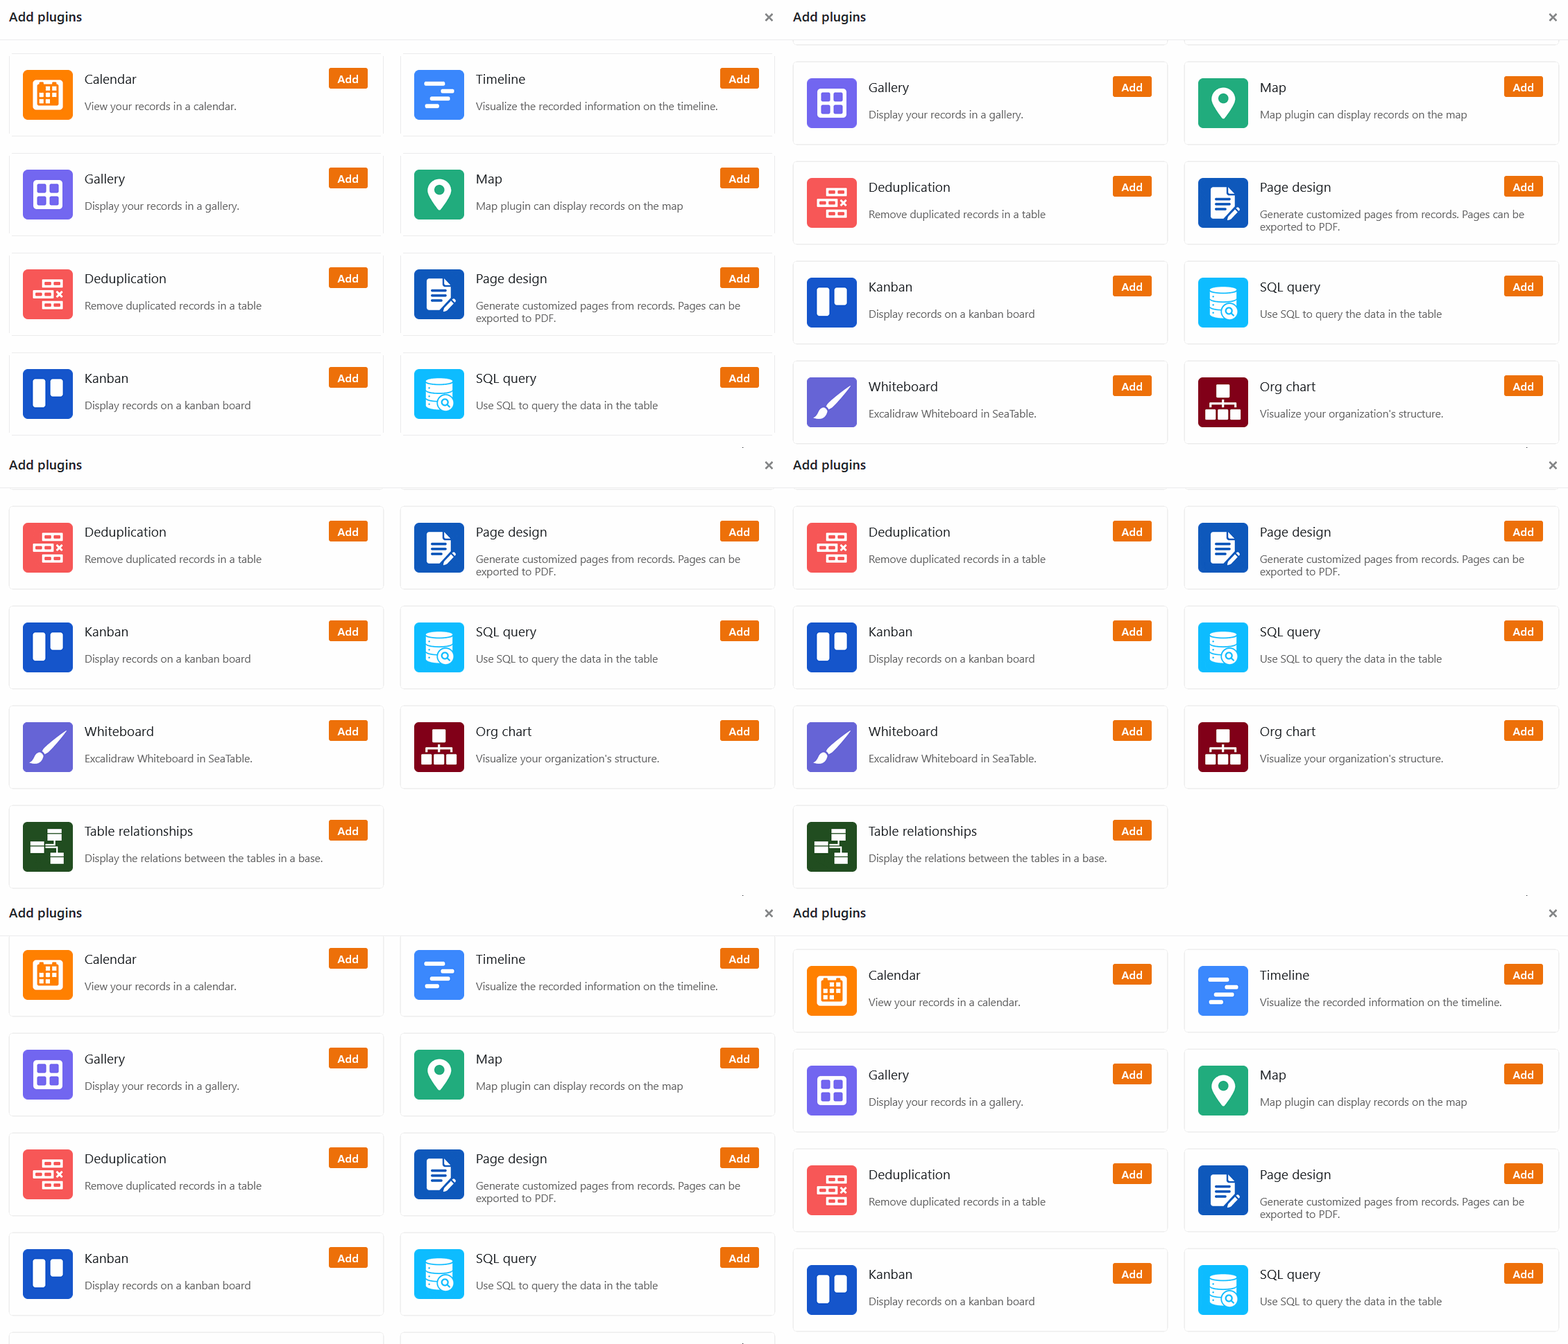
You activate the plugins via the Plugin Manager, which you open via the Plugins button in the top right corner of the Base header. You can learn how to add plugins to your Base here. Plugins are always activated only for the opened Base. You may have to repeat the activation of plugins in other Bases.
With the calendar plug in and the timeline plugin you can keep track of your appointments and deadlines and organize projects successfully. With the Gallery plug in you manage images quickly and easily in your Base.
Display addresses and position data on a map using the Map plugin and visualize your tasks and project phases with the Kanban plugin. The Page Design plugin helps you quickly turn your records into laid out documents.

